Reviewing and Filtering Data
Once a station is selected from the “Select Station” tab, an “Input” tab is generated to display all information contained in the selected station folder. The “Input” tab allows for user interaction with the laboratory and sensor variables, and filters by date or specific variable range in order to control what parameters contribute to the regression analysis.
NOTE: The example data is artificial and generated to demonstrate OPTICS capabilities only. The locations are arbitrarily selected.
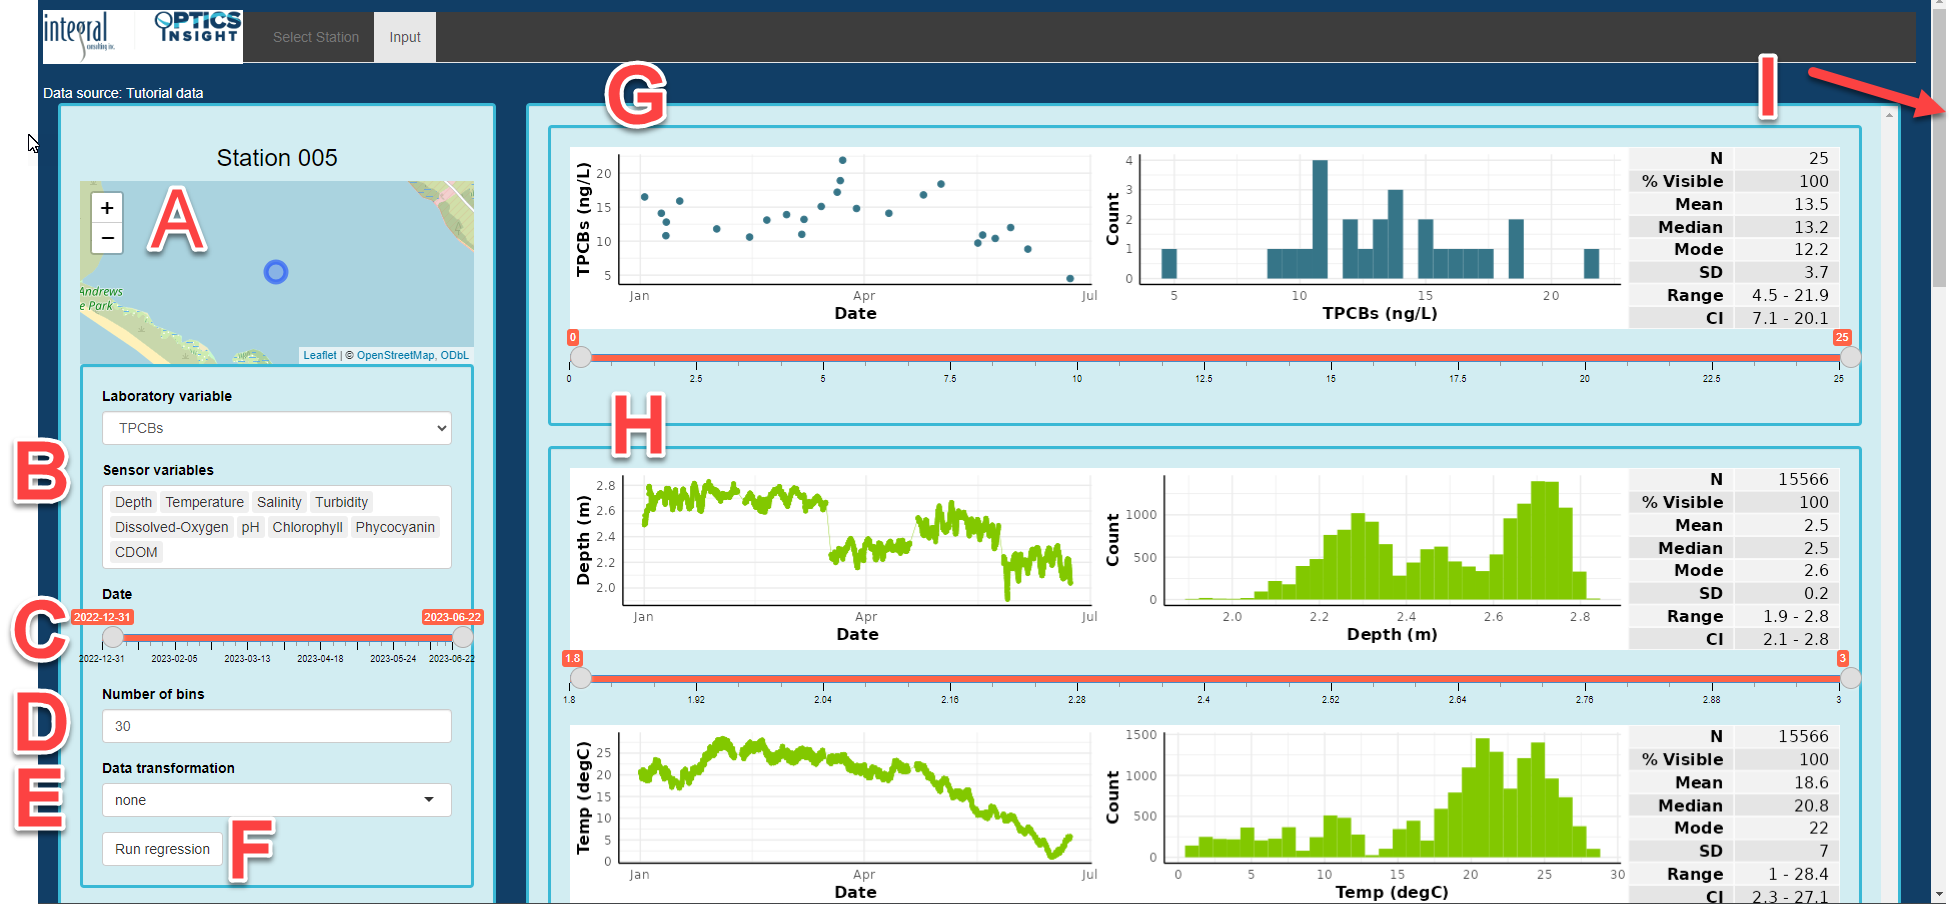
The “Input” window is composed of the following elements:
A) Station location map for the selected dataset
B) List of laboratory (contaminant) and sensor (environmental) variables available for this station. Note that all variables that are selected in this window will be used in the regression analysis. You can select one sensor variable at a time to delete it from the list. If you want to add it back into the list, place your cursor after the last variable and move the cursor using the arrows on the keyboard to a place in between two variables where you want to add it, then start typing the variable name and select from the drop-down menu. NOTE: you cannot drag and reorder variables, but instead have to delete one, then proceed with moving your cursor using the keyboard arrows to the place where you want to add it.
C) A global date-time sliding scale that allows for temporal selection of data. The date-time scale can be changed at both ends to specify the period of interest for analysis.
D) The “Number of bins” controls the histogram plots and can be adjusted to assist the user to better review and understand the data. This is simply for reviewing the data, and does not physically bin the data in any way.
E) The “Data transformation” tab provides the user with the option of performing either a log transformation or square root transformation of the data. This setting will adjust the figures of each of the variables in the space to the right, and will carry through to the regression analysis. The user is expected to apply a transformation when deemed appropriate for their dataset.
F) The “Run regression” is the button that runs the modeling analysis after all data filtering and optional transformation is complete.
G) Time-series and histogram plots of the selected laboratory variable along with sliding selector to query specific values. The laboratory variable displayed is the one selected in section “B.”
H) Plot of all sensor variables in the order they are displayed in the box under section B. You can move their location to change the order of these time-series/histogram plots. The range of values for each of the variables can be independently filtered and settings are carried forward to regression analysis.
I) The scroll bar to the right allows the user to view all sensor variables contributing to a regression analysis.
Sensor Variable Selection
Laboratory variables will vary by dataset and can be selected from the the drop-down menu on the left-hand panel. Only one laboratory variable at a time can be selected and used in the regression analysis. Sensor variables can be deleted, and added back in using the “Sensor variables” box of the left-hand panel. Deleting a variable will remove it from analysis. Simply highlight the variable to delete an select the “Delete” button. To include a variable back in the “Sensor variables” list, place the cursor in the window, and move the cursor with the left arrows to the place within the list where the plots should be drawn. Plots are drawn in the order they are placed in the “Sensor variables” box.
Filtering and Transforming Data
Filtering data by either time (in the left-hand panel) or by a user-defined range of each variable will adjust the dataset and be incorporated in the subsequent regression analysis. For instance, if a user defines the minimum depth to be two (2) meters, all data points below two meters will be removed across all plots and excluded from analysis. The date-time slider bar is a global setting. Changing a filter setting will take a short time as all figures are updated; a pulsing bar indicates when this update to figures is occurring.
Modifying the bins allows the user to evaluate each laboratory and sensor dataset and determine if the data are normally distributed. Depending on the user’s discretion, a data transformation (either a log or square root transformation) can be applied to the dataset. Once the desired filters and settings are selected, the user can perform the regression analysis by selecting the “Run regression” button.